Trading Apps For Studying Stock Prices And Price Trend Review
Understanding stock prices is an important part of participating in the equity market. Prices change throughout trading sessions because of company developments, market conditions, investor activity, economic factors, and other events. Investors therefore need suitable tools to observe price movements and review historical trends before making decisions.
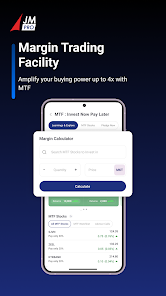
Trading Apps provide convenient access to market prices, charts, watchlists, alerts, and other information through digital devices. An Online Trading App can help investors follow selected stocks, compare price movements, and review market information without depending on a desktop computer. However, these tools should support research rather than replace careful analysis.
Understanding Stock Prices and Price Trends
A stock price represents the market value at which shares are being bought and sold. During market hours, prices can move frequently as buyers and sellers place orders.
A price trend describes the general direction in which a stock has moved over a particular period. A stock may show an upward trend, downward trend, or relatively stable movement. Studying these patterns can help investors understand past behaviour, although historical price movements do not guarantee future results.
Why Price History Matters
Looking at a single day's price may provide limited information. Reviewing historical prices over several weeks, months, or years can provide a broader perspective.
Investors can examine previous highs and lows, periods of increased activity, and changes in price over different timeframes. This information can then be considered alongside company performance and broader market conditions.
Short-Term and Long-Term Price Movements
Short-term traders may focus on movements during a trading session or across several days. Long-term investors may be more interested in trends that develop over months or years.
The same stock can show different patterns depending on the timeframe selected. For this reason, investors should choose time periods that match their research objectives rather than relying on one chart view.
How Trading Apps Support Price Research
Modern Trading Apps can bring several market-monitoring tools into one platform. These tools can make it easier to observe stocks and organize information for further research.
Live and Historical Price Data
Many trading platforms provide current market prices along with historical information. Investors can use this data to observe how a stock has performed during different periods.
Current prices can be useful when monitoring an existing holding, while historical data can help with broader trend analysis. Investors should also consider whether prices are affected by corporate actions or other market events when comparing historical information.
Interactive Stock Charts
Charts are among the most commonly used tools for studying stock prices. An Online Trading App may allow users to adjust chart periods and view different types of price information.
Depending on the platform, investors may be able to examine opening prices, closing prices, daily highs, daily lows, and trading volumes. Some platforms also provide technical indicators that can be used by investors who understand how they work.
Charts can make price information easier to interpret, but they should not be viewed as a complete assessment of a company's financial condition.
Using Watchlists for Regular Monitoring
A watchlist allows investors to keep selected stocks together in one place. Instead of searching for individual companies repeatedly, users can add stocks they are researching and monitor them regularly.
Organizing Stocks by Interest
Investors can create watchlists based on their research needs. For example, one list could contain companies being considered for long-term investment, while another could contain stocks being observed for short-term market movements.
This organization can make research more structured and reduce the need to search for the same securities repeatedly.
Observing Price Changes
Regularly observing a watchlist can help investors become familiar with the normal price behaviour of different stocks. They may notice periods of higher volatility, changes in trading volume, or significant movements following company announcements.
These observations should be combined with reliable company and market information before making investment decisions.
Reviewing Price Trends With Charts
Price trend analysis involves examining how prices have moved over a selected period. Investors can use charts to identify general patterns rather than focusing only on individual price changes.
Identifying Highs and Lows
Previous highs and lows can provide useful context when studying price movements. Investors may examine whether a stock has repeatedly moved around certain price levels.
However, past price levels do not guarantee that a stock will behave in the same way in the future. Market conditions can change quickly.
Understanding Trading Volume
Trading volume indicates the number of shares traded during a particular period. Changes in volume can provide additional information when reviewing price movements.
For example, a significant price movement accompanied by higher trading volume may warrant further research. Investors should still consider the reason behind the movement instead of interpreting volume in isolation.
Using Technical Indicators Carefully
Some Trading Apps provide technical indicators that investors can apply to price charts. Common examples include moving averages and other statistical measures.
Moving averages can help smooth short-term price fluctuations and show a broader direction over a selected period. Other indicators may provide information about momentum or price conditions.
These tools can support analysis, but they have limitations. Investors should understand what an indicator measures and how it fits into their research process before relying on it.
Combining Price Research With Company Analysis
Stock price movements should not be studied separately from the company behind the stock. A price change may be connected to earnings, revenue growth, debt levels, management decisions, industry developments, or other factors.
Investors can review financial statements, company announcements, earnings information, and industry conditions alongside price charts.
An Online Trading App may provide some of this information directly or connect users with relevant market data. Where information is limited, investors should refer to reliable financial and company sources.
Setting Price Alerts
Price alerts can help investors monitor specific price levels without constantly checking their applications.
For example, an investor researching a particular stock may set an alert for a price level that requires further review. Once the notification is received, the investor can examine the latest market information before deciding whether any action is appropriate.
Alerts should be viewed as reminders rather than automatic trading signals.
Reviewing Market Trends Regularly
Market conditions can change because of economic data, interest rate decisions, global developments, company announcements, and investor sentiment. A price trend that appears strong during one period may change later.
Regular review can therefore be more useful than relying on a single analysis. Investors can compare current prices with previous data and consider whether the original reasons for monitoring a stock remain relevant.
Mistakes to Avoid During Price Trend Review
One common mistake is focusing only on short-term price movements. Temporary changes may not represent a company's longer-term direction.
Another mistake is assuming that a previous trend will continue indefinitely. Markets can change because of unexpected developments.
Investors should also avoid using too many technical indicators without understanding them. A chart containing numerous signals can make research more complicated rather than clearer.
Finally, investors should avoid making decisions based solely on rumours, social media discussions, or unverified market claims.
Conclusion
Trading Apps can make it easier to study stock prices, review historical movements, organize watchlists, monitor trading volume, and set price alerts. When used carefully, these features can help investors develop a more structured approach to market research.
An Online Trading App can support price trend review by bringing charts and market information together in one place. However, stock price analysis works best when combined with company research, market awareness, risk assessment, and clearly defined investment objectives. Using these tools for research rather than relying on price movements alone can help investors approach stock market decisions with greater discipline.